✳ Representations
What the learned embeddings reveal
Two models can score similarly yet organize drum style very differently. Beyond macro-F1, the embeddings expose how each model structures style, and how stable that structure is.
01 · Why look past accuracy
Macro-F1 says how often a model is right, not how it understands the task. To compare understanding, the high dimensional embeddings of each model are projected to two dimensions with t-SNE and summarized by class centroids, the average position of each style. Tracking how far those centroids move between training runs measures the stability of a model's representation.
02 · Embedding structure · interactive
Explore the embedding space
Switch between models, then move the slider to reproject the same embeddings at different t-SNE perplexities. Low perplexity emphasises local neighbourhoods; high perplexity favours global structure. PaSST keeps coherent clusters by primary style across the whole sweep, while the CNN organises into smaller, more local groups.
Drag to zoom, double click to reset, click a style in the legend to hide it. Move the slider to reproject the same embeddings at a different t-SNE perplexity.


03 · Where the models confuse styles
Confusion concentrates on neighbouring styles
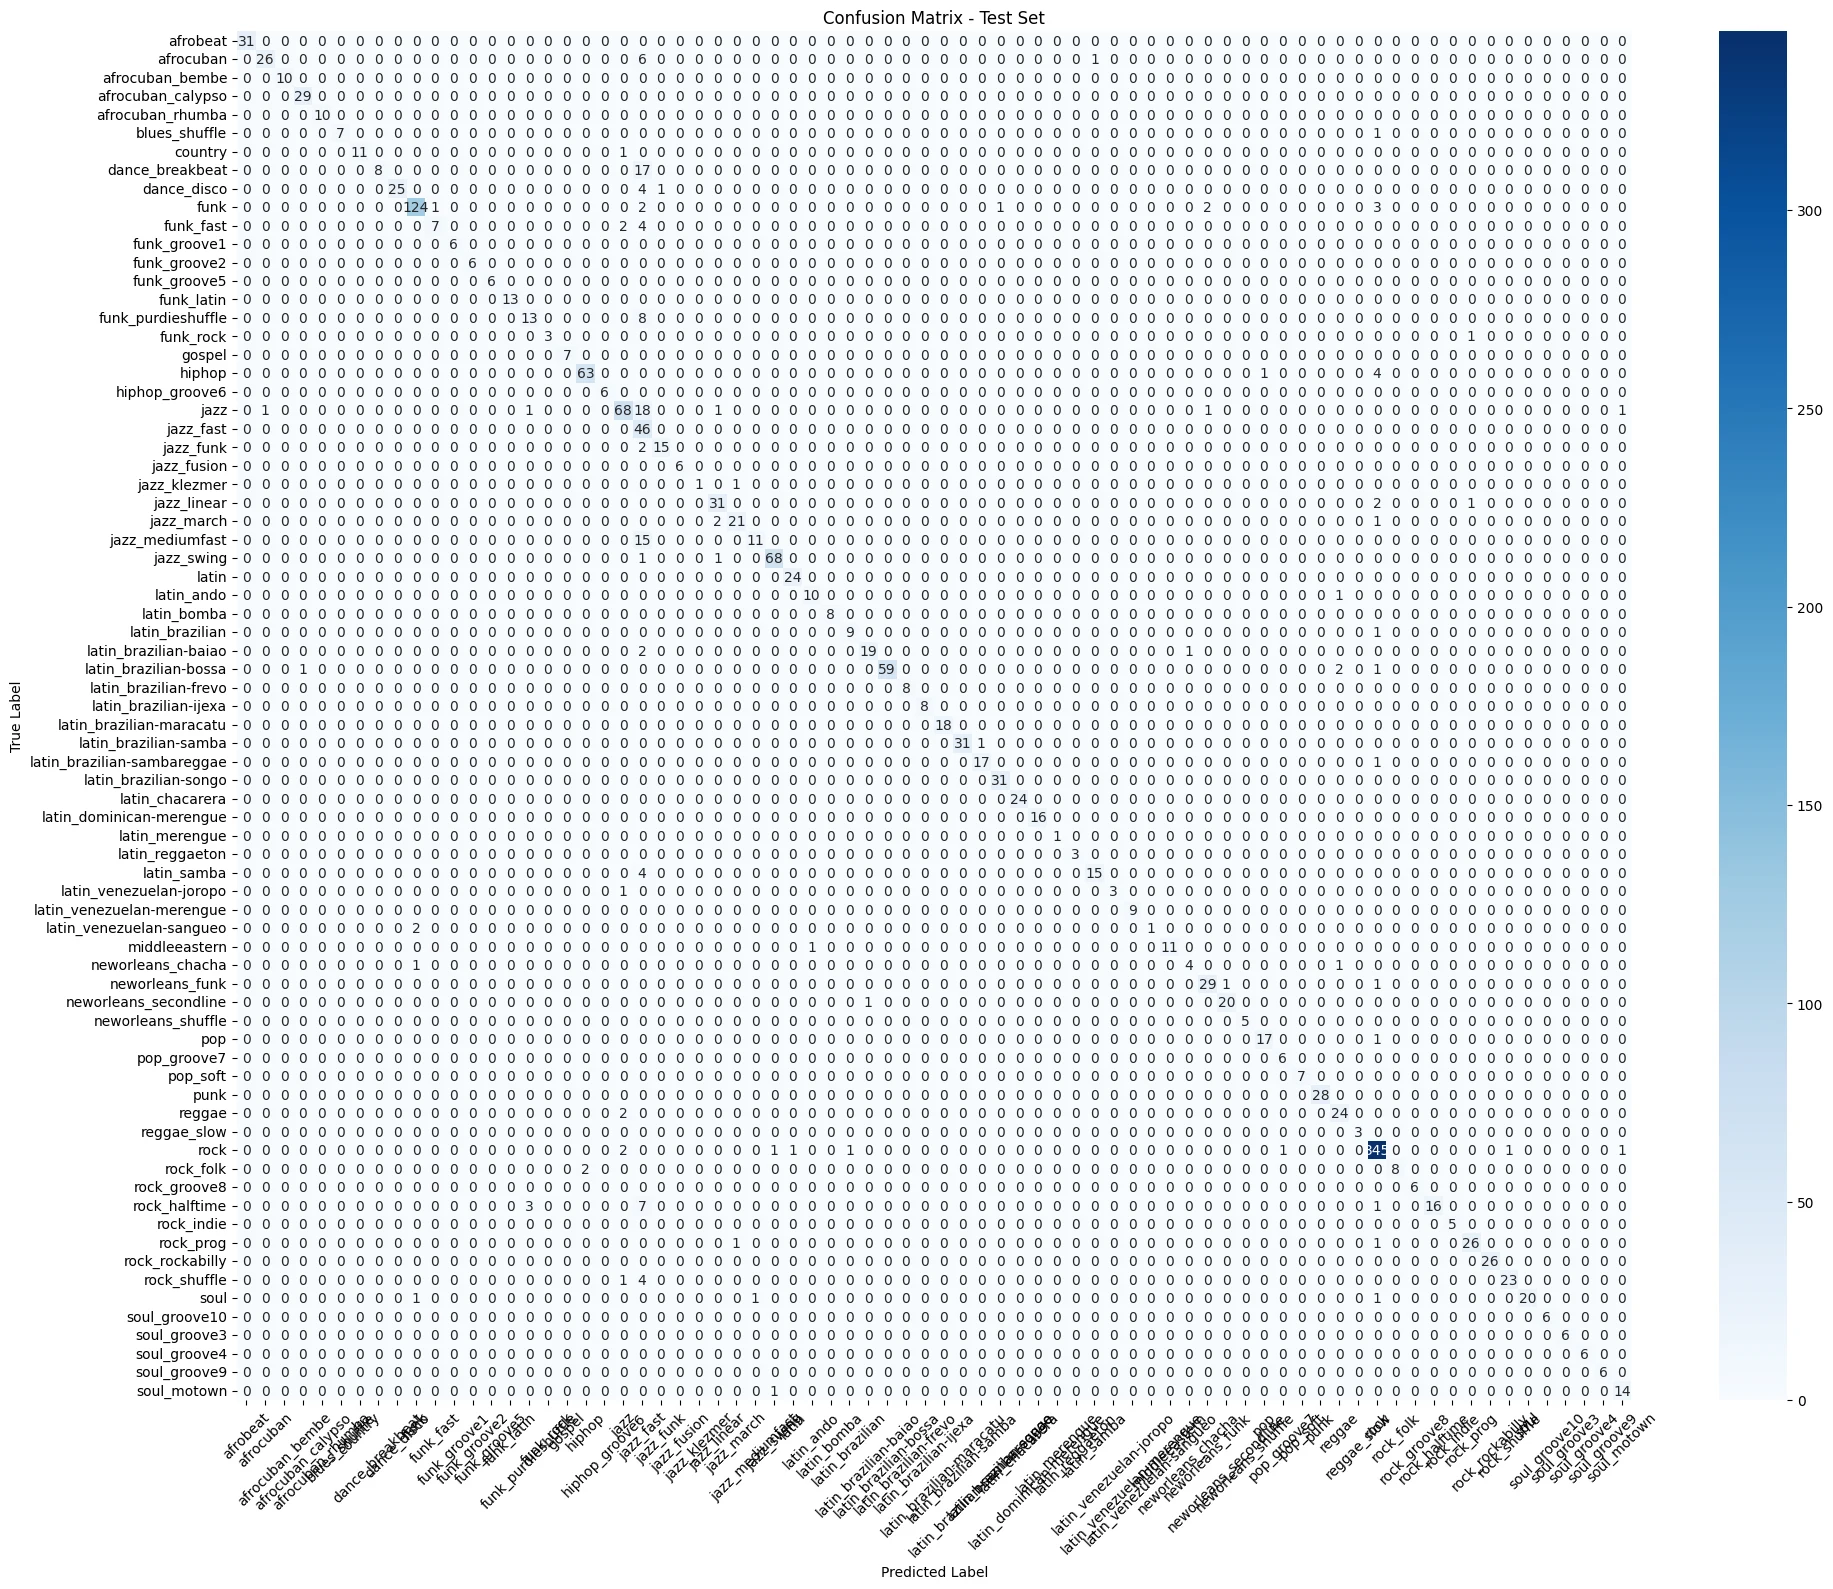
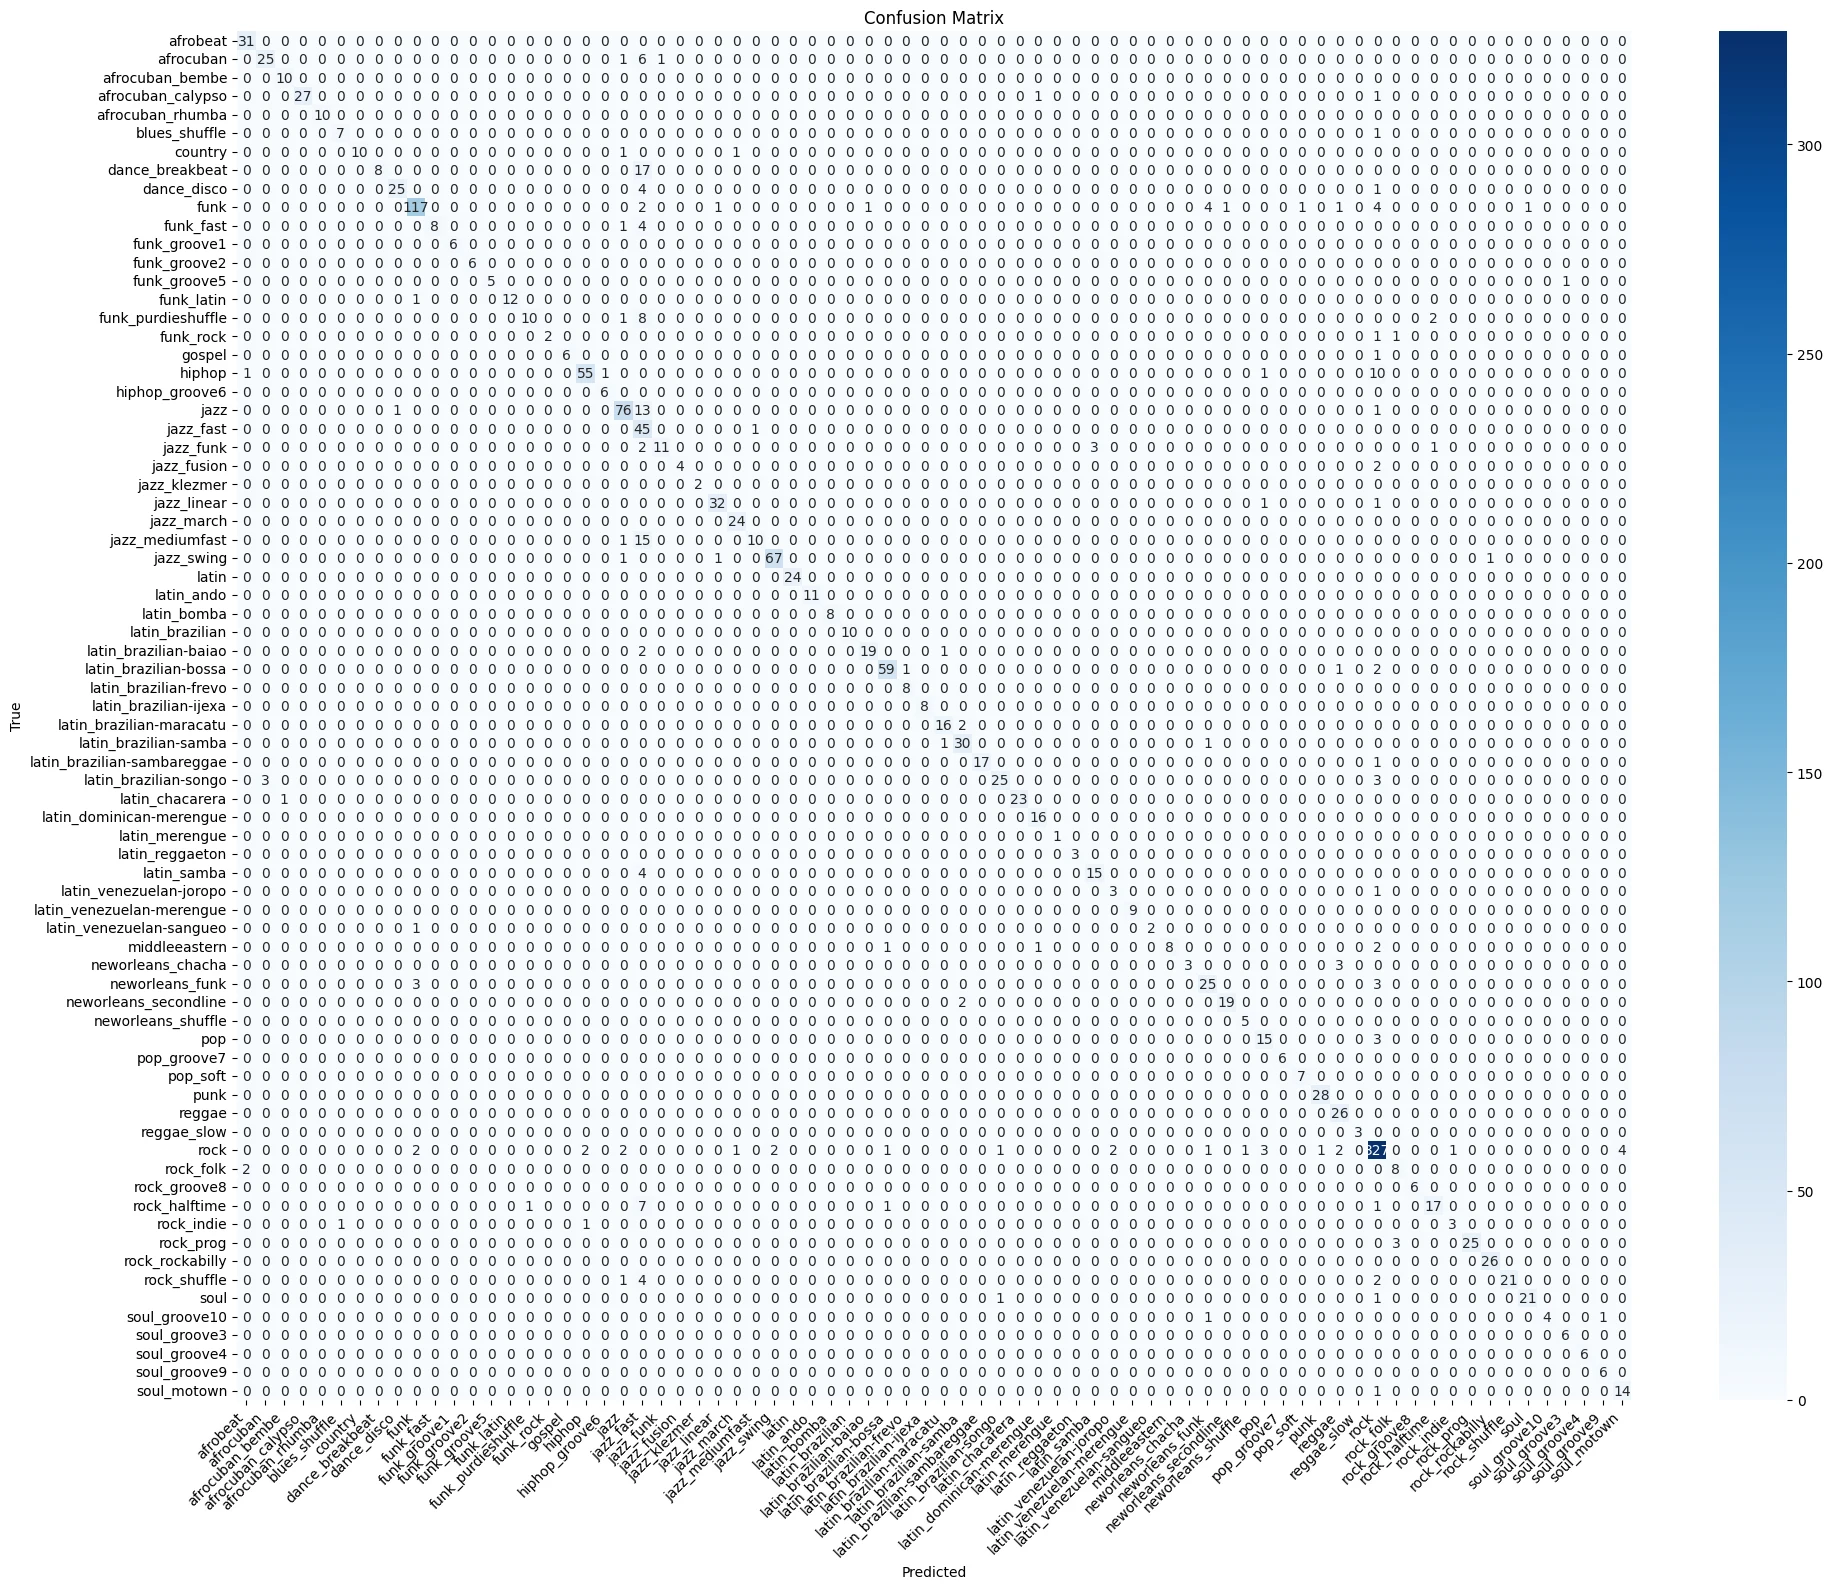
Both models keep a strong diagonal but stumble on stylistically adjacent classes, like jazz fast with dance breakbeat and jazz mediumfast, and funk with hip hop. The CNN also overpredicts the dominant rock classes, a symptom of class imbalance.
04 · The caveat
05 · Stability under padding and augmentation
How far the centroids move, by intervention
Each bar is the mean distance a model's primary style centroids travelled from its baseline run under a given change. The scales are completely different: the CNN's space lurches under every intervention, reflection padding most of all, while PaSST barely moves. Read each model on its own axis.
And which styles move the most
06 · What it suggests
A more hierarchical space, at a cost in accuracy
Taken together, PaSST's small, evenly distributed shifts and tight primary style clustering suggest its AudioSet pretraining carries a stable, hierarchical “world model” of audio that transfers to drum style. The CNN's large, uneven shifts, concentrated in a handful of styles, point to a more local, task fitted representation that is more sensitive to class imbalance and to interventions like padding.
This is the heart of the thesis's nuance: the CNN wins on aggregate macro-F1, yet PaSST organizes style more robustly. Accuracy and representational quality are not the same axis.